
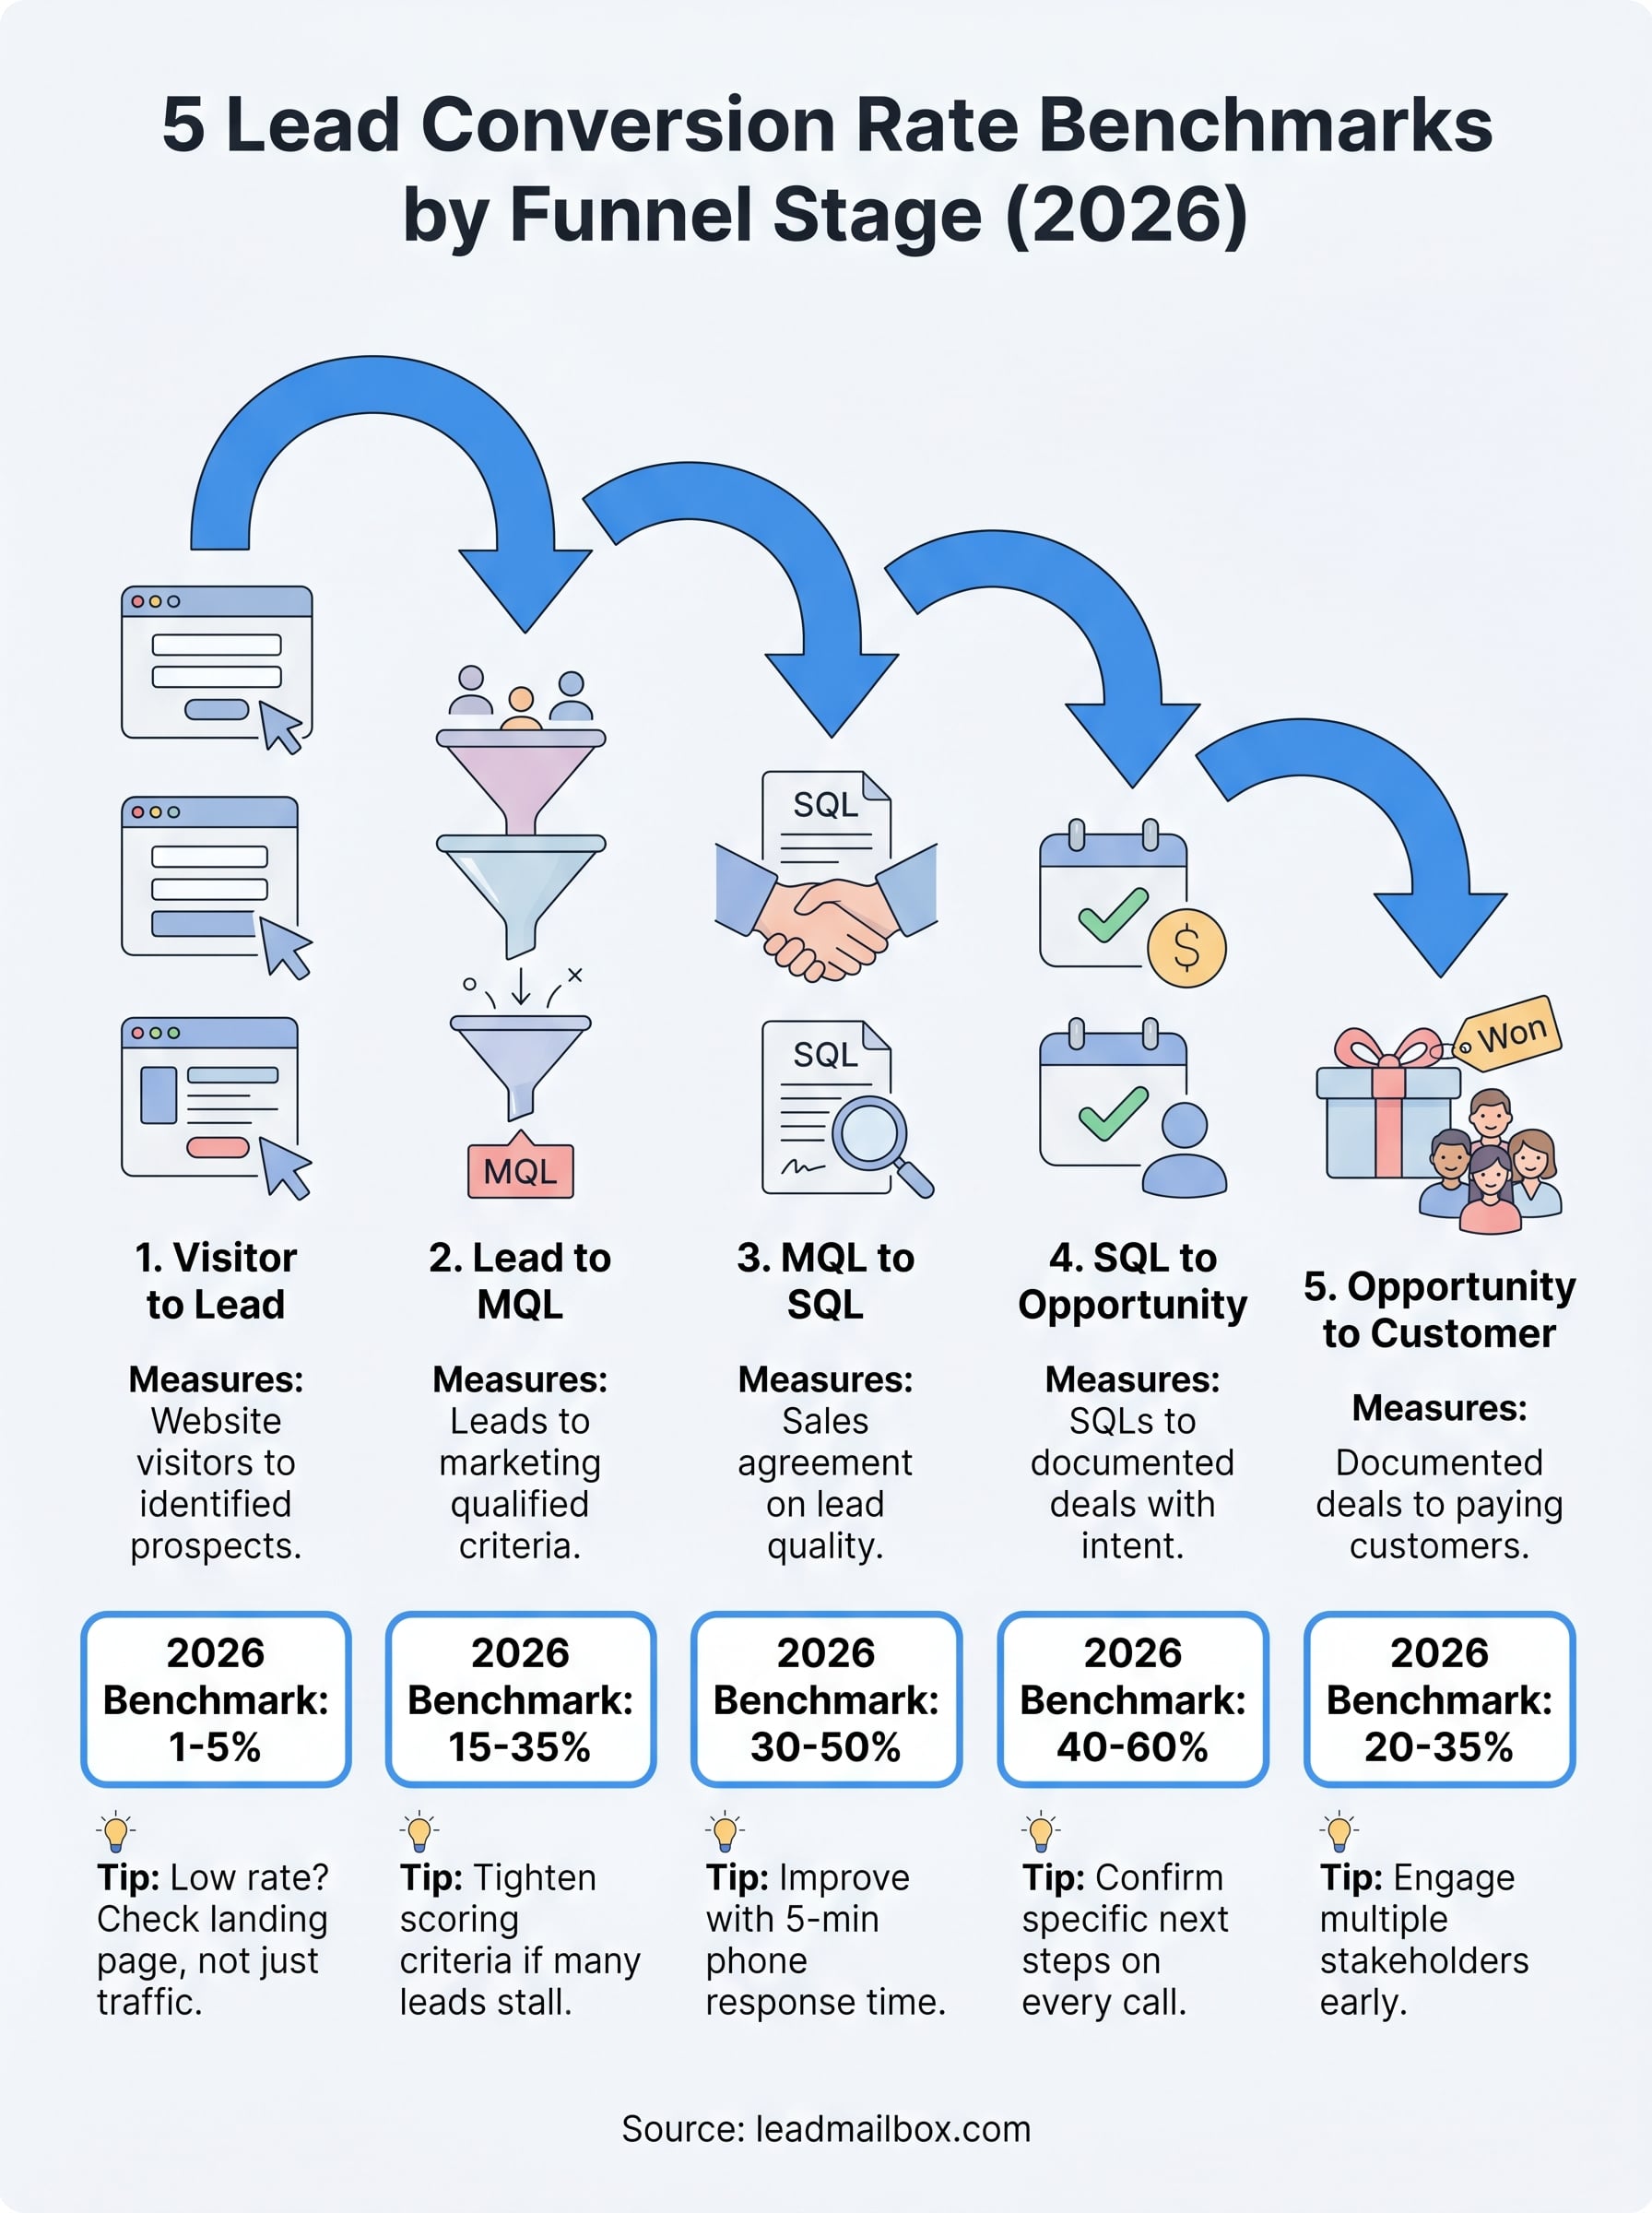
5 Lead Conversion Rate Benchmarks by Funnel Stage (2026)
You're generating leads, spending money on campaigns, and pushing your sales team to follow up faster, but how do you know if your numbers are actually good? Without clear lead conversion rate benchmarks, you're essentially guessing. And guessing doesn't scale. What looks like a healthy pipeline in one funnel stage might be a serious bottleneck when you compare it to industry data.
The problem is that most benchmark data floating around is outdated, overly broad, or pulled from enterprise-level companies that don't reflect how small and mid-sized sales teams actually operate. You need numbers broken down by funnel stage, from initial inquiry all the way to closed deal, so you can pinpoint exactly where leads are falling off and what "good" looks like at each step.
That's exactly what this article covers. We've compiled five key benchmarks across the major funnel stages for 2026, along with context on what drives those numbers up or down. At LeadMailbox, we've spent over 20 years helping businesses manage and convert leads from multiple sources through one platform, so we've seen firsthand where most teams leave money on the table. Use these benchmarks to audit your own pipeline and figure out where to focus next.
1. Visitor to lead conversion rate
The visitor-to-lead stage is where your entire funnel begins, which means weak conversion here amplifies every problem downstream. This metric tells you how effectively your website and landing pages turn anonymous traffic into identifiable prospects you can actually work with.
What this stage measures and what counts as a lead
This rate divides total leads captured by total website visitors over a set period. A lead at this stage is someone who completed a form, called an inbound number, initiated a chat, or took another action that identifies them as a prospect and puts them into your pipeline.
2026 benchmark ranges for visitor to lead
Most industries land between 1% and 5%, with high-performing B2C sites pushing above 5% and complex B2B environments settling closer to 1-2% due to longer research cycles and higher-friction offers.
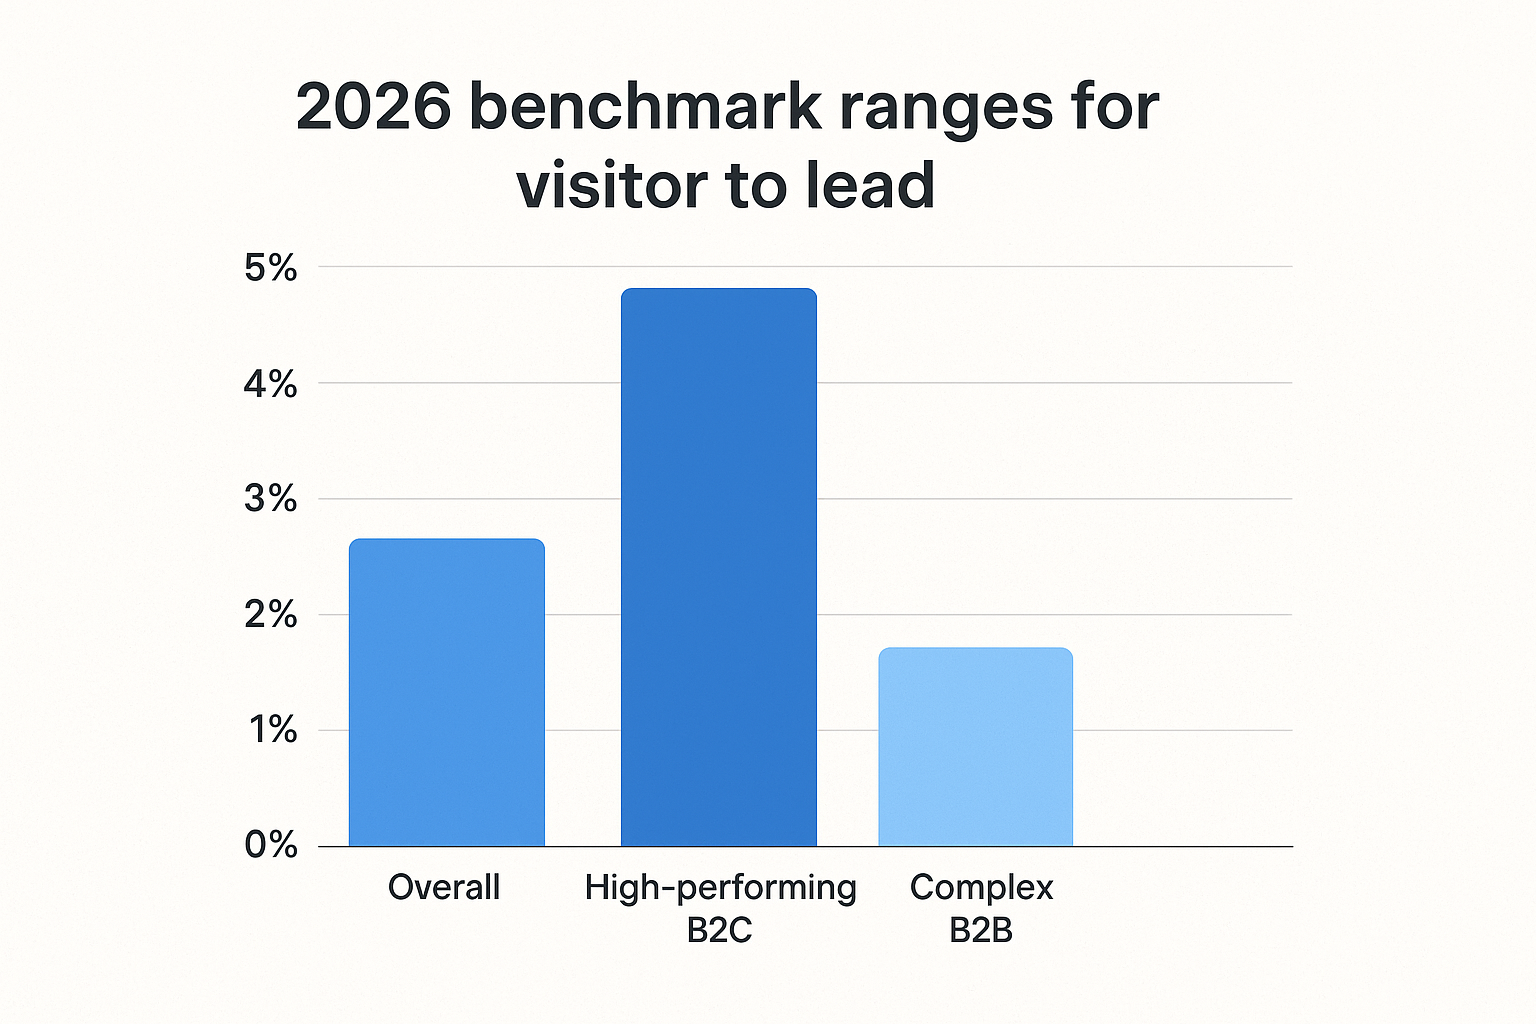
If your visitor-to-lead rate is below 1%, you likely have a landing page problem, not a traffic problem.
Benchmarks by acquisition source and intent level
Source matters as much as volume when you evaluate lead conversion rate benchmarks. High-intent paid search traffic converts at 3-6%, organic search lands at 1-4%, social media typically runs 0.5-2%, and display advertising often falls below 1% because audience intent is lowest at that entry point.
Common tracking mistakes that skew this benchmark
Many teams inflate their numbers by counting bot form submissions and duplicate entries as real leads. Others inadvertently deflate performance by firing conversion events on form views rather than actual completions, which makes a solid campaign look like it's failing.
What usually drives wins and losses at this stage
Page load speed and form length are the two biggest factors. Forms with more than four fields typically drop conversion by 10-20%, and pages taking longer than three seconds to load lose a measurable share of visitors before they see your offer at all.
How to track visitor to lead in LeadMailbox
LeadMailbox pulls leads from multiple sources into one dashboard, so you can see which channels drive volume and which underperform. Connecting your lead partners and inbound channels gives you accurate source-level data without manual reconciliation or missed attribution.
2. Lead to MQL conversion rate
Once a lead enters your pipeline, the next filter determines whether marketing can confirm it's worth a sales rep's attention. This stage is where raw volume meets qualification logic, and where weak definitions cost your team the most wasted effort.
What this stage measures and how to define MQL
This rate divides marketing qualified leads by total leads captured in a given period. An MQL is a lead that meets preset criteria like company size, job title, or engagement signals that your team has agreed predict genuine purchase intent.
2026 benchmark ranges for lead to MQL
Across industries, 15% to 35% is the typical range. B2B companies with tight qualification models land toward the lower end, while high-volume B2C pipelines with broader scoring thresholds often push higher.
If fewer than 10% of your leads reach MQL status, your lead sources or scoring model likely needs adjustment before you increase spend.
Benchmarks by lead type and lead source
Inbound organic leads convert to MQL at 20-35%, while purchased or syndicated leads frequently fall below 15% because intent is weaker at the point of capture compared to someone who sought you out directly.
The biggest reasons leads never become MQLs
Most leads stall here because scoring criteria are vague or inconsistently applied across the team, which means similar leads get treated differently depending on who reviews them.
How to tighten MQL rules without starving sales
Review sales rejection reasons from the previous quarter and identify the most common patterns. Tighten your scoring model around those specific gaps rather than guessing at abstract engagement thresholds.
How to report lead to MQL cleanly
Accurate reporting requires timestamping each status change, not just when a lead first entered the system. This approach ties your lead conversion rate benchmarks directly to campaign timing so you can spot delays rather than mask them.
3. MQL to SQL conversion rate
This stage tests whether sales agrees with marketing's judgment on lead quality. It's the handoff point where your lead conversion rate benchmarks either hold together or start to fall apart.
What this stage measures and how to define SQL
Divide total SQLs accepted by sales by total MQLs passed over in a given period. An SQL is a lead a rep has reviewed and confirmed meets your BANT or equivalent qualification criteria, making it ready for active pursuit.
2026 benchmark ranges for MQL to SQL
Across industries, 30% to 50% is the standard range. Longer sales cycles compress this toward 30%, while high-velocity transactional environments push it closer to 55%.
If your rate falls below 25%, you likely have a qualification gap and a follow-up speed problem running simultaneously.
Benchmarks by response speed and first touch channel
Phone contact within five minutes of an MQL trigger can lift SQL conversion by up to 30% compared to delayed outreach. Email-first sequences consistently underperform phone for high-intent leads as a first touch channel.
Where most handoffs break between marketing and sales
Most rejections happen because no written SQL definition exists that both teams agreed on. Monthly rejection reviews fix this gap faster than any scoring model adjustment alone.
How to diagnose whether you have a quality problem or a follow-up problem
Compare rejection rates by contact timing across your team. Leads contacted after 24 hours get rejected at significantly higher rates regardless of fit, which means response speed is the first variable to address.
How to lift MQL to SQL with better prioritization
Work your MQL queue by engagement recency, not arrival order. Reps who contact the most recently active leads first consistently produce stronger SQL conversion numbers without changing anything else in the process.
4. SQL to opportunity conversion rate
At this stage, your rep has accepted the lead and is actively working it. The SQL to opportunity rate measures how many of those accepted leads actually progress into a real, documented deal with defined next steps, a budget conversation started, and a decision-maker engaged.
What this stage measures and what counts as an opportunity
Divide total opportunities created by total SQLs in a period. An opportunity is a lead where your rep has confirmed buying intent, timeline, and access to the right contact, not just a completed first call.
2026 benchmark ranges for SQL to opportunity
Most sales teams convert 40% to 60% of SQLs into opportunities. High-velocity inside sales environments push toward 65%, while complex, multi-stakeholder deals settle closer to 35%.
If your SQL to opportunity rate drops below 30%, focus on discovery quality before increasing SQL volume.
Benchmarks by deal size and sales cycle length
Smaller deal sizes under $5,000 convert to opportunity faster and at higher rates, often 55-65%. Larger deals with longer cycles drop to 35-45% because more people need to approve the decision.
The discovery and qualification gaps that kill opportunities
Most SQLs stall here because reps skip structured discovery and pitch before confirming fit. Without a repeatable questioning framework, reps misjudge intent and advance leads that were never real.
How to spot weak-fit SQLs before reps waste time
Review your lead conversion rate benchmarks by rep and compare opportunity creation rates. Reps with low rates are often accepting SQLs too loosely or skipping budget qualification on the first call.
How to improve conversion without lowering opportunity quality
Train reps to document specific next-step commitments at the end of every first call. Leads without a scheduled follow-up should return to nurture rather than advancing to opportunity status prematurely.
5. Opportunity to customer conversion rate
This stage converts documented deals into paying customers. Your close rate here reflects overall sales execution quality more directly than any other metric in your funnel.
What this stage measures and how to avoid double counting
Divide closed-won new customers by total opportunities created in the same period. Keep upsells and renewals in a separate pipeline so they don't inflate your new-business close rate and distort your baseline.
2026 benchmark ranges for opportunity to customer
Most teams close 20% to 35% of opportunities. High-performing inside sales environments push toward 40%, while complex multi-stakeholder deals settle between 15% and 25%.
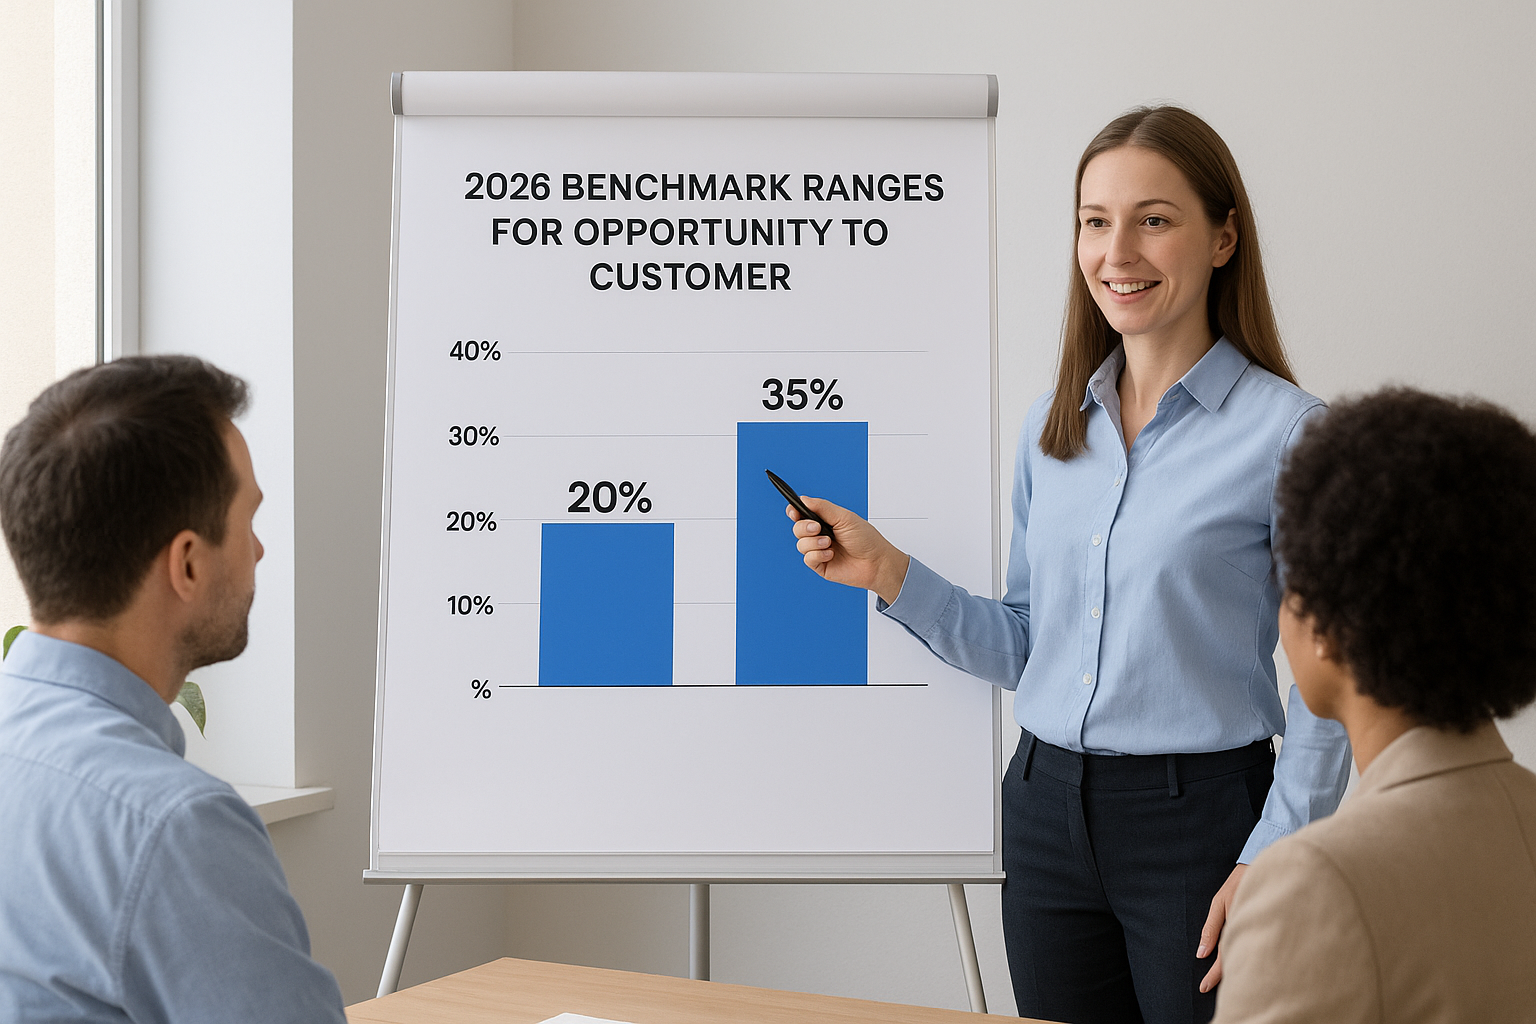
If your close rate falls below 15%, late-stage execution gaps deserve more attention than increasing top-of-funnel volume.
Benchmarks by pipeline stage and buying committee size
Single decision-maker deals close at 30-40%, while deals requiring three or more stakeholders drop to 18-28% due to alignment friction across the buying group.
The most common late-stage reasons deals stall or die
Most losses trace back to unresolved objections avoided during discovery, followed closely by proposals sent without a defined follow-up commitment from the prospect.
How to improve close rate without discounting
Build relationships with more than one contact per account early. Reps who engage multiple stakeholders consistently close at higher rates without adjusting pricing or terms to win.
How to use stage-by-stage benchmarks to forecast revenue
Applying your lead conversion rate benchmarks across all five stages lets you build a grounded revenue model. Multiply your opportunity volume by your close rate to produce a realistic revenue projection rather than an optimistic guess.
Next steps
You now have a clear picture of what strong performance looks like at every stage of your funnel. These lead conversion rate benchmarks give you a baseline to measure against, but the real value comes from knowing which stage is actually holding your revenue back right now. Pick the one metric that looks furthest from the benchmark ranges in this article and focus your next 30 days there.
Running down every stage at once spreads your attention too thin and produces slower results than targeting your single biggest drop-off point first. Once you close that gap, move to the next one. That approach compounds quickly.
If you're managing leads from multiple sources and struggling to track conversion across stages in one place, LeadMailbox gives you the tools to aggregate, work, and measure every lead without stitching together separate systems. Start there and build your benchmark tracking on a foundation that actually holds together.