
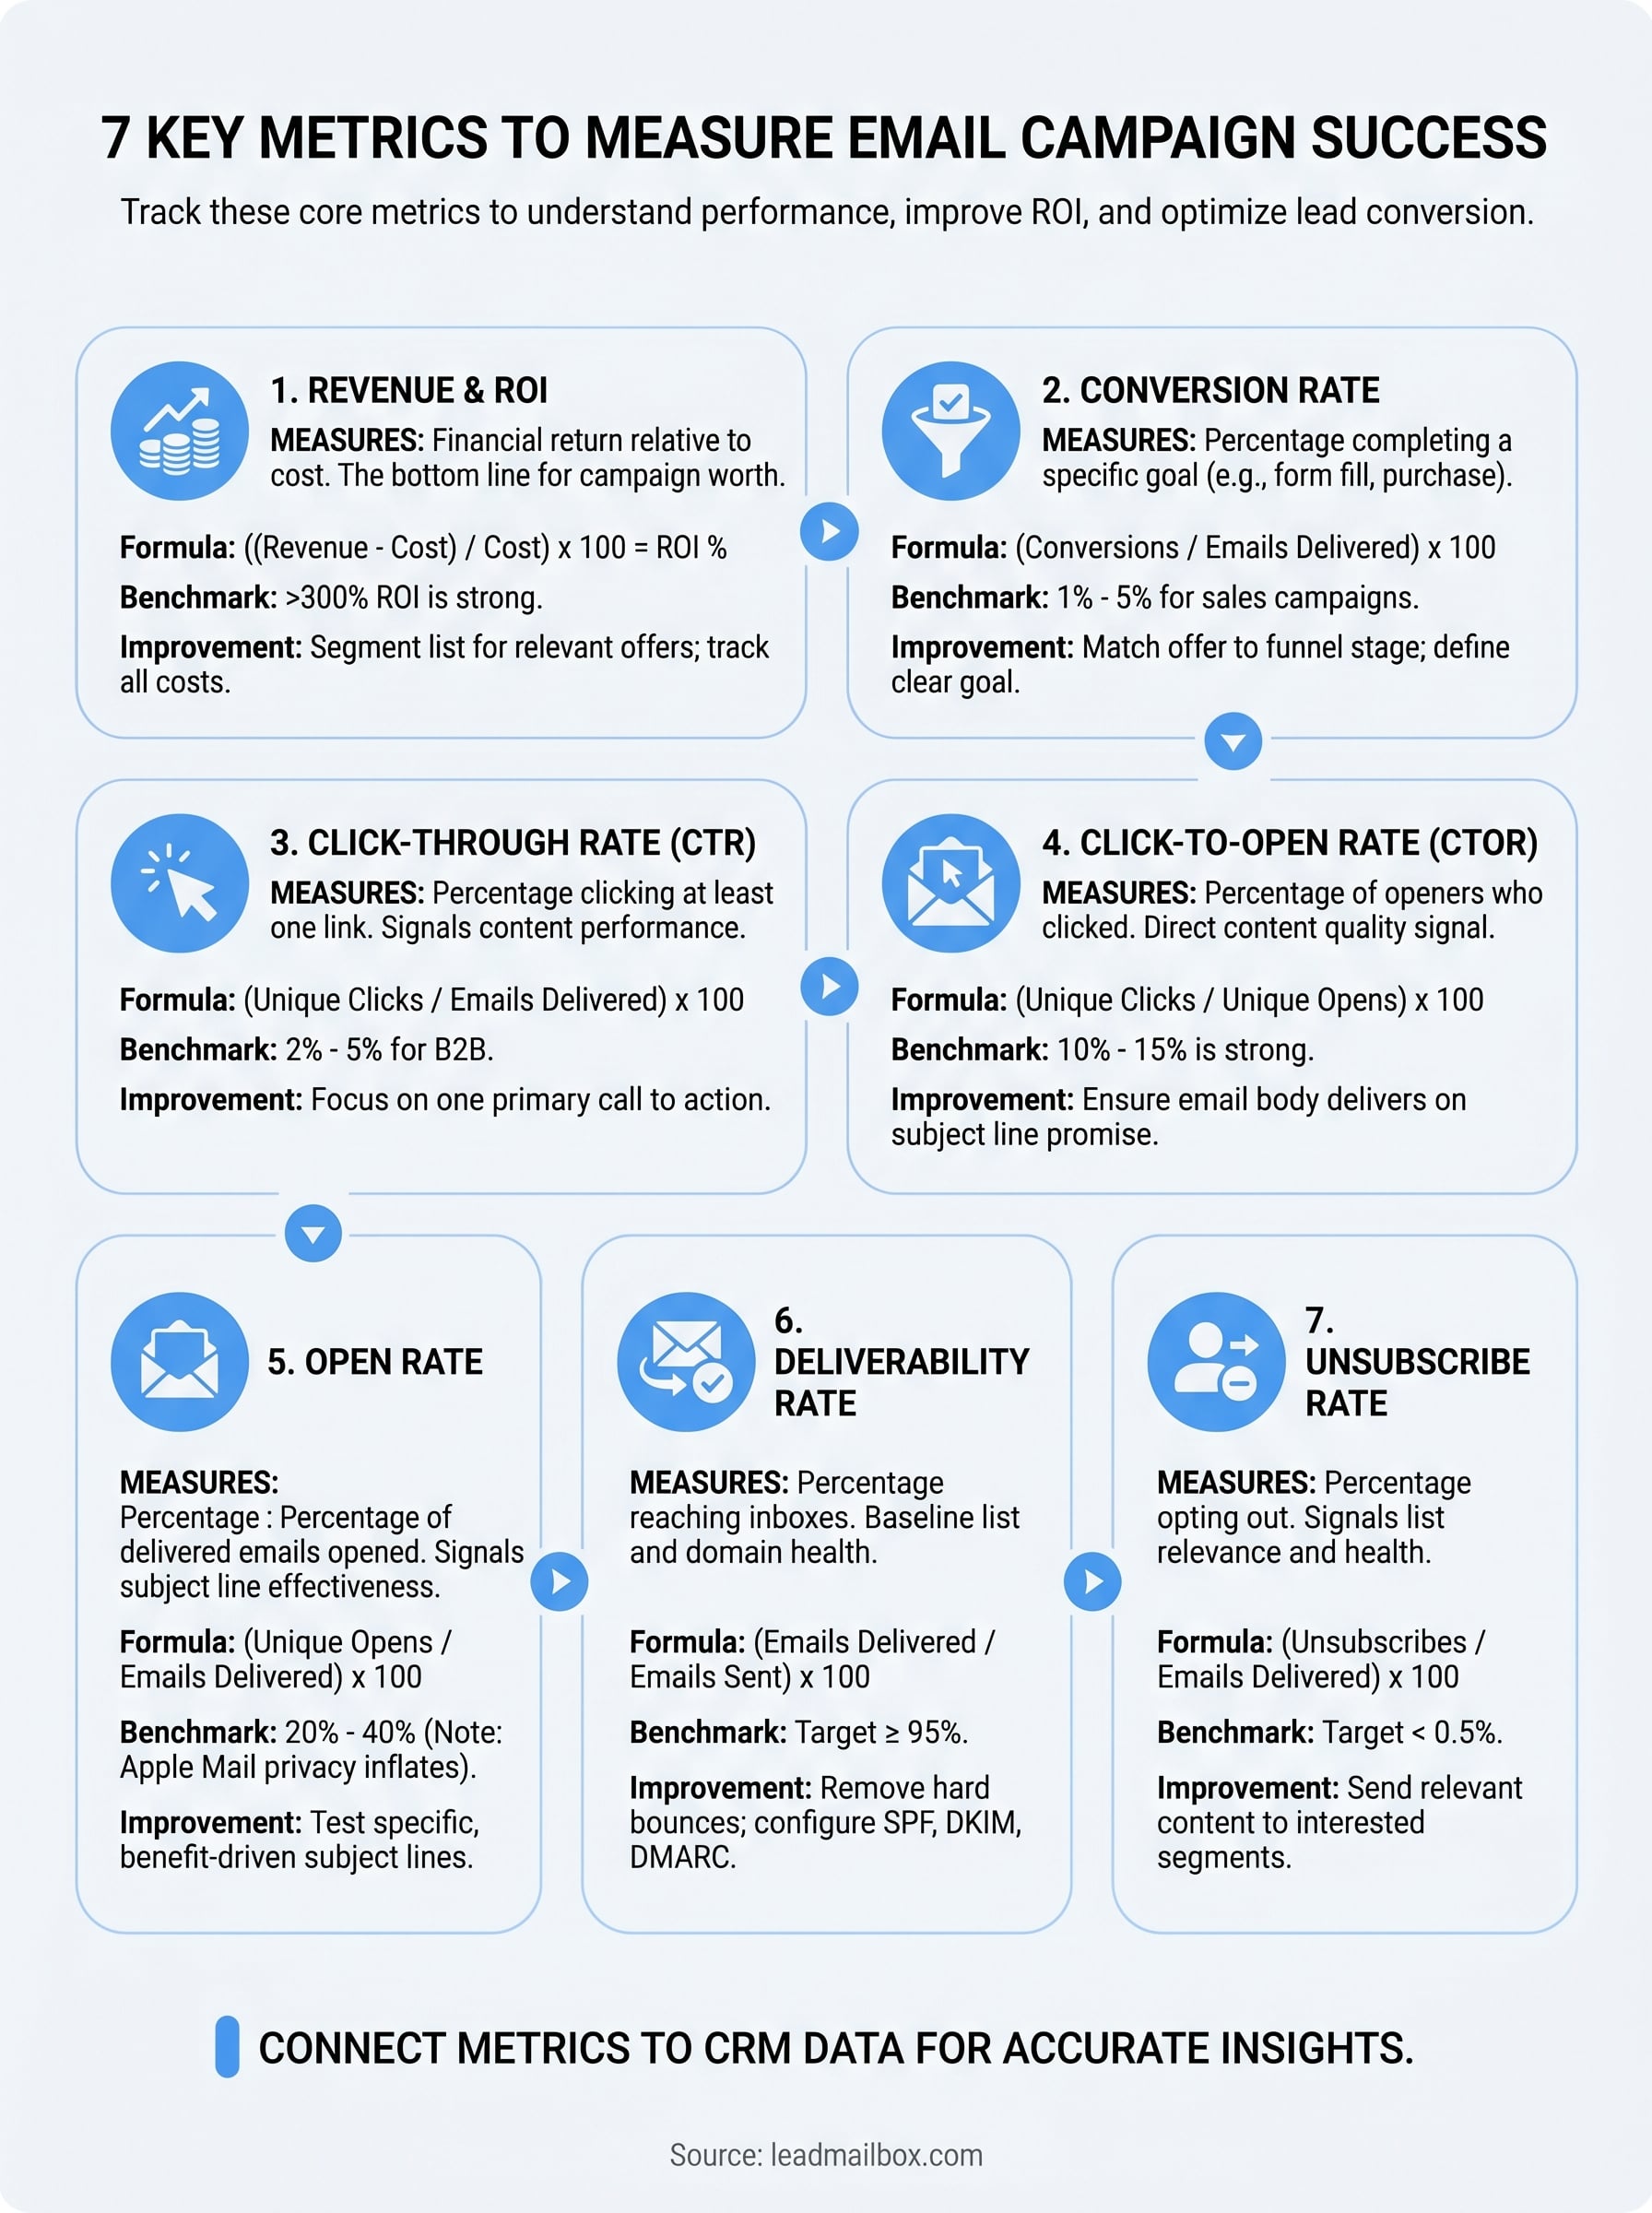
How To Measure Email Campaign Success: 7 Key Metrics
You hit send on an email campaign, watch a few opens trickle in, and then... what? If you're not sure how to measure email campaign success, you're essentially flying blind, spending time and money on outreach without knowing what's actually working. That's a problem, especially when email remains one of the highest-ROI channels for sales teams and small businesses.
The good news: you don't need a data science degree to figure this out. A handful of core metrics will tell you whether your emails are landing, getting read, and driving real action. The key is knowing which numbers matter, how to calculate them, and what benchmarks to measure yourself against. Without that clarity, even a well-written campaign can quietly underperform for months before anyone notices.
At LeadMailbox, our platform includes email campaign tools built for lead conversion, so we've seen firsthand what separates campaigns that generate pipeline from ones that get ignored. In this guide, we'll break down 7 essential metrics that give you a clear, honest picture of how your email campaigns are actually performing.
1. Revenue and ROI
Revenue and ROI sit at the top of this list for a reason: they're the only metrics that directly answer whether your email campaign is worth the time and money you're putting into it. Every other metric on this list is a supporting signal. This one is the bottom line.

What it measures
Return on investment (ROI) tells you how much revenue your campaign generated relative to what it cost you to run it. That cost includes your email platform, any labor involved in writing and setting up the campaign, and any paid list or lead acquisition. Tracking this number gives you a real financial picture of your email program, not just engagement statistics.
How to calculate it
The formula is straightforward: subtract your campaign cost from the revenue generated, divide that by the campaign cost, then multiply by 100 to get a percentage.
ROI = ((Revenue Generated - Campaign Cost) / Campaign Cost) x 100
For example, if a campaign cost you $500 to run and brought in $5,000 in revenue, your ROI is 900%. To track revenue accurately, you need to connect your email platform to your CRM or sales data so you can tie closed deals back to specific campaigns.
The biggest mistake most teams make is calculating ROI without including all costs, which inflates the number and leads to bad decisions.
What "good" looks like
Email marketing consistently delivers some of the highest ROI of any channel, with industry figures often cited around $36 to $42 returned for every $1 spent. Your actual number will vary based on your industry, list quality, and offer, but anything above a 300% ROI is a strong signal your campaign is working.
Common tracking mistakes
The most common mistake is only counting direct online conversions while ignoring deals that started with an email but closed over the phone. If your sales process involves any human touchpoints, you need to ask new customers how they first heard from you and log that manually in your CRM.
How to improve it
Segment your list so you're sending relevant offers to the right contacts rather than blasting everyone with the same message. Tighter targeting typically lifts both conversion rates and average deal size, which pushes ROI up fast without requiring a bigger send volume.
2. Conversion rate
Conversion rate tells you something deeper than whether people opened your email. It tells you whether they actually did what you asked them to do. When you're thinking about how to measure email campaign success, this metric is one of the clearest signals that your messaging and offer are working together.
What it measures
Conversion rate tracks the percentage of email recipients who completed a specific goal, such as filling out a form, booking a call, or making a purchase. That goal needs to be defined before you send, not after the fact.
How to calculate it
Divide the number of conversions by the number of emails delivered, then multiply by 100.
Conversion Rate = (Conversions / Emails Delivered) x 100
Tie your conversion tracking directly to your CRM so you capture the full picture, not just online form fills.
What "good" looks like
Conversion rates vary widely by industry and goal, but a typical range for sales-focused campaigns sits between 1% and 5%. A campaign driving a free consultation will usually convert higher than one pushing a direct purchase.
Common tracking mistakes
The most frequent error is tracking clicks instead of actual conversions, which can make a campaign look successful when it is not. If someone clicks but never completes the action, that click is not a conversion and should not count toward your goal.
How to improve it
Match your offer to the right stage of your funnel. A cold lead needs a lower-friction call to action than a warm prospect who has already engaged with your brand multiple times.
3. Click-through rate
Click-through rate (CTR) is one of the most useful data points when figuring out how to measure email campaign success at the content level. While open rate tells you whether people opened the email, CTR tells you whether they took the next step and clicked something inside it.
What it measures
CTR tracks the percentage of recipients who clicked at least one link in your email. This includes links to landing pages, product pages, or any other destination you're driving people toward. It's a direct signal of how well your email body and call to action are actually performing.
How to calculate it
Divide the number of unique clicks by the number of emails delivered, then multiply by 100. Using unique clicks gives you a cleaner read on how many individual people responded to your content.
CTR = (Unique Clicks / Emails Delivered) x 100
Use unique clicks rather than total clicks so one person clicking multiple times doesn't inflate your numbers.
What "good" looks like
Average CTRs for B2B campaigns typically fall between 2% and 5%. Sales-focused emails with a single, clear call to action tend to perform at the higher end of that range.
Common tracking mistakes
Counting total clicks instead of unique clicks is a common error that makes your list look more engaged than it actually is. You want to know how many individual people clicked, not how many times any given link was hit overall.
How to improve it
Keep your email focused on one primary call to action. When you give recipients multiple competing links, you split their attention and reduce the likelihood they'll click on the link that drives your actual campaign goal.
4. Click-to-open rate
Click-to-open rate (CTOR) gives you a more focused view than CTR when figuring out how to measure email campaign success. While CTR measures clicks against all delivered emails, CTOR narrows the lens to only people who actually opened your email, showing you whether your content convinced an already-engaged audience to act.
What it measures
CTOR tracks the percentage of openers who clicked at least one link in your email. This separates your content quality from outside variables like list size or deliverability, giving you a direct read on how well your email body and call to action work together once someone is already reading.
How to calculate it
Divide unique clicks by unique opens, then multiply by 100.
CTOR = (Unique Clicks / Unique Opens) x 100
CTOR is one of the cleanest content quality signals available because it removes list size and send volume from the equation entirely.
What "good" looks like
A CTOR between 10% and 15% is considered strong for B2B and sales-focused campaigns. Rates below 10% typically point to a content or offer problem, not a subject line problem.
Common tracking mistakes
Using total clicks and total opens instead of unique counts for both will inflate your CTOR and make your content look more effective than it actually is. Always verify that your platform reports unique values for each metric before pulling conclusions.
How to improve it
Match your email body directly to the promise in your subject line. If your subject line sets an expectation, your content needs to honor it immediately, then present one clear, low-friction action for the reader to take.
5. Open rate
Open rate is often the first metric people check when learning how to measure email campaign success, but it works best as a directional signal rather than a definitive measure. It tells you how well your subject line and sender name are doing their job.
What it measures
Open rate tracks the percentage of delivered emails that were opened by recipients. It reflects how compelling your subject line is and whether your sender name carries enough recognition to earn a click in a crowded inbox.
How to calculate it
Divide unique opens by emails delivered, then multiply by 100.
Open Rate = (Unique Opens / Emails Delivered) x 100
Open rate has become less reliable since Apple's Mail Privacy Protection now pre-loads email content, which artificially inflates opens for Apple Mail users.
What "good" looks like
Average open rates across industries typically fall between 20% and 40%, with B2B sales emails often landing in the lower half of that range. Treat your benchmark as a relative trend indicator rather than a fixed target.
Common tracking mistakes
The biggest mistake is treating open rate as a measure of content quality. It only reflects whether someone opened the email, not whether they read it or found it useful. Inflated numbers from bot activity or privacy tools can further distort your read.
How to improve it
Test your subject lines systematically using A/B splits rather than guessing. Short, specific subject lines that reference a real pain point or outcome consistently outperform vague or generic phrasing in sales-focused campaigns.
6. Deliverability rate
Deliverability rate often gets overlooked when teams are learning how to measure email campaign success, but it's the foundation everything else depends on. If your emails aren't reaching inboxes, every other metric on this list becomes meaningless.
What it measures
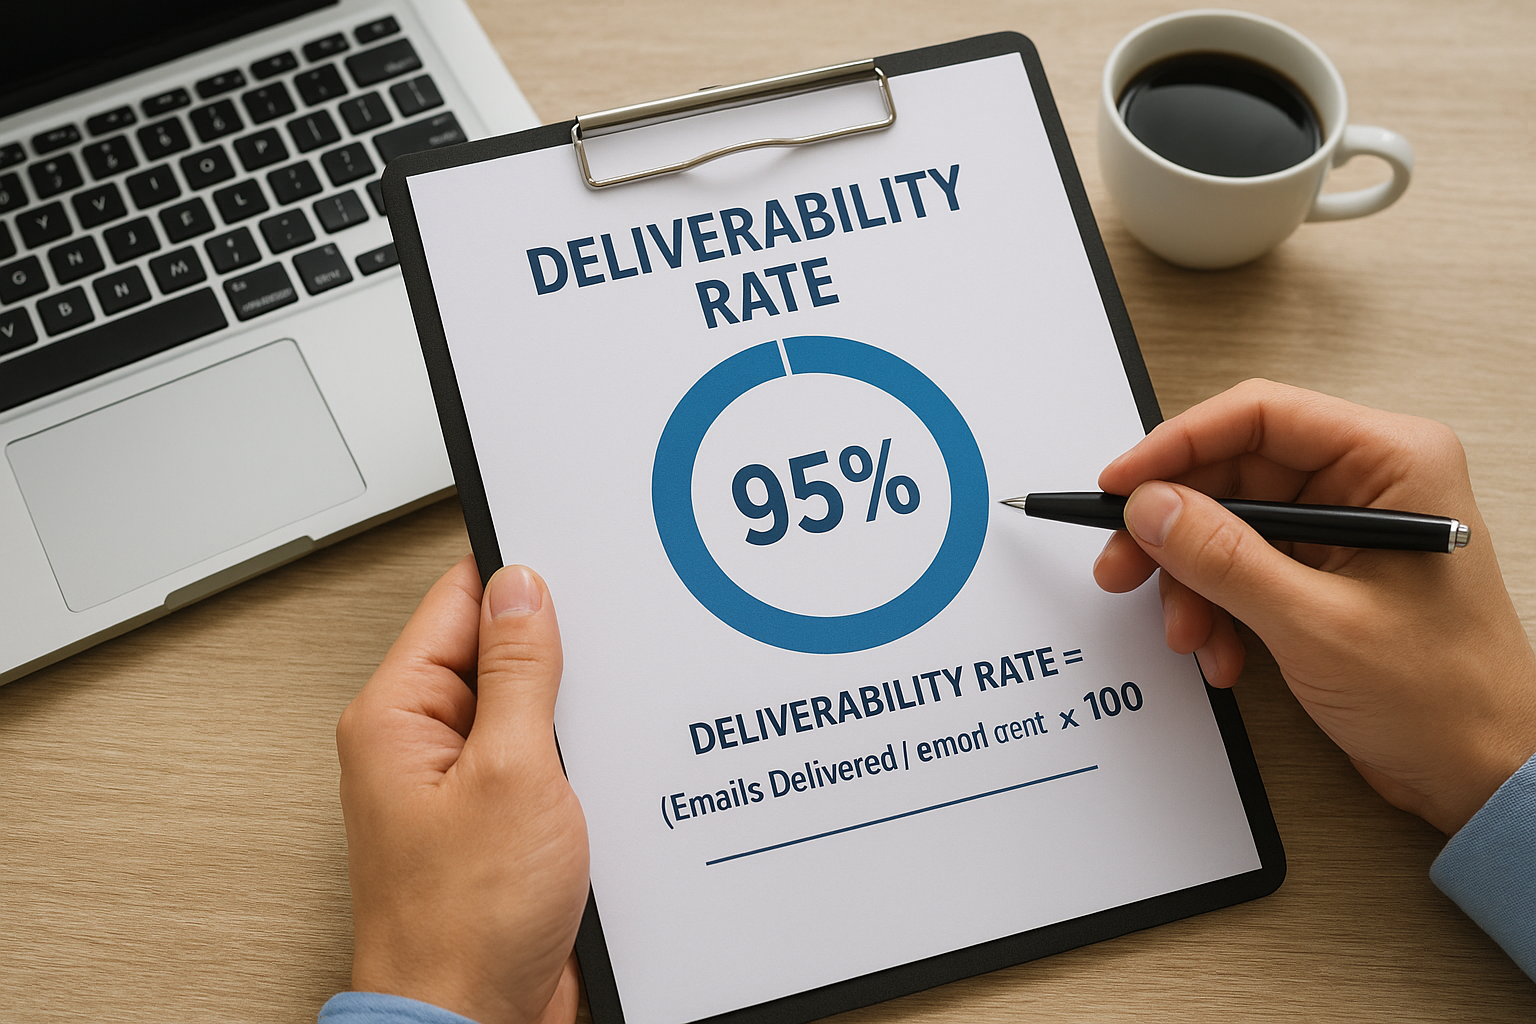
Deliverability rate tracks the percentage of sent emails that successfully reached recipients without bouncing or being blocked by mail servers. It reflects the health of your sending domain, list quality, and sender reputation with inbox providers.
How to calculate it
Divide emails delivered by total emails sent, then multiply by 100.
Deliverability Rate = (Emails Delivered / Emails Sent) x 100
A strong deliverability rate is the baseline requirement for any email campaign to perform at all.
What "good" looks like
A deliverability rate of 95% or higher is the standard you should target. Rates below 90% signal serious list or domain reputation issues that need immediate attention before your next send.
Common tracking mistakes
Many teams confuse deliverability rate with inbox placement rate. A delivered email simply means it wasn't bounced, not that it landed in the primary inbox. Spam folder placement counts as delivered but will kill your engagement numbers without any obvious warning.
How to improve it
Remove hard bounces from your list immediately after every send. Keeping bad addresses damages your sender reputation over time. Also confirm that your domain has proper SPF, DKIM, and DMARC records configured so inbox providers treat your emails as legitimate.
7. Unsubscribe rate
Unsubscribe rate is often dismissed as unavoidable churn, but when you're working out how to measure email campaign success, it gives you a direct signal about list health and message relevance. A spike in unsubscribes after a specific campaign is data worth paying close attention to.
What it measures
Unsubscribe rate tracks the percentage of recipients who opted out of your list after receiving an email. It tells you whether your audience finds your content relevant and worth receiving, or whether you've lost alignment between your list and your messaging.
How to calculate it
Divide the number of unsubscribes by emails delivered, then multiply by 100.
Unsubscribe Rate = (Unsubscribes / Emails Delivered) x 100
Tracking unsubscribes per campaign rather than just overall gives you a much sharper view of which specific messages are pushing people away.
What "good" looks like
An unsubscribe rate below 0.5% is the standard benchmark for most email programs. Rates that consistently exceed 1% signal a relevance problem that will compound over time if you don't address the root cause.
Common tracking mistakes
Many teams monitor total unsubscribes without segmenting by campaign type, which hides which specific sends are driving the most opt-outs. You need campaign-level data to make useful decisions about what to fix.
How to improve it
Send only to contacts who have a genuine reason to receive your message. Reducing send frequency for disengaged contacts and tightening your list segments will lower unsubscribe rates without requiring you to rethink your entire content strategy.
Next steps
Now you have a clear framework for how to measure email campaign success across the metrics that actually matter. Revenue and ROI tell you whether your campaigns are worth running. Conversion rate, CTR, and CTOR tell you whether your content and offers are working. Open rate, deliverability, and unsubscribe rate tell you whether your list health and sender reputation are in good shape. Together, these seven metrics give you a complete picture of where your email program stands and exactly where to focus your attention.
Tracking all of this manually is a significant burden, especially when you're also managing leads from multiple sources and running outreach across different channels. A platform that connects your email campaigns directly to your lead management and CRM data makes measuring these metrics faster and more accurate. If you want to see how that works in practice, explore LeadMailbox's email campaign tools and see how they fit your sales process.